
Building Dashboards in Salesforce
Dashboards present the data as visual components, that are easier to understand and interpret. We have learned about the reports in other modules. But, the report is a mere presentation of organized data, and might not be interpreted readily for decision making. Dashboards brief the data in detail, and one can interpret it even with one single glance. Moreover, dashboards can be customized on the fly, as per the requirement. Dashboard in Salesforce allows us to combine different reports, and present it as a single visual entity. Just imagine, the sales manager has to access opportunity reports, sales reports, account reports, to understand how many opportunities were closed, and how many accounts were onboarded. Think of a dashboard, where you get all this information at a single place.
Key Features of the Dashboard in Salesforce
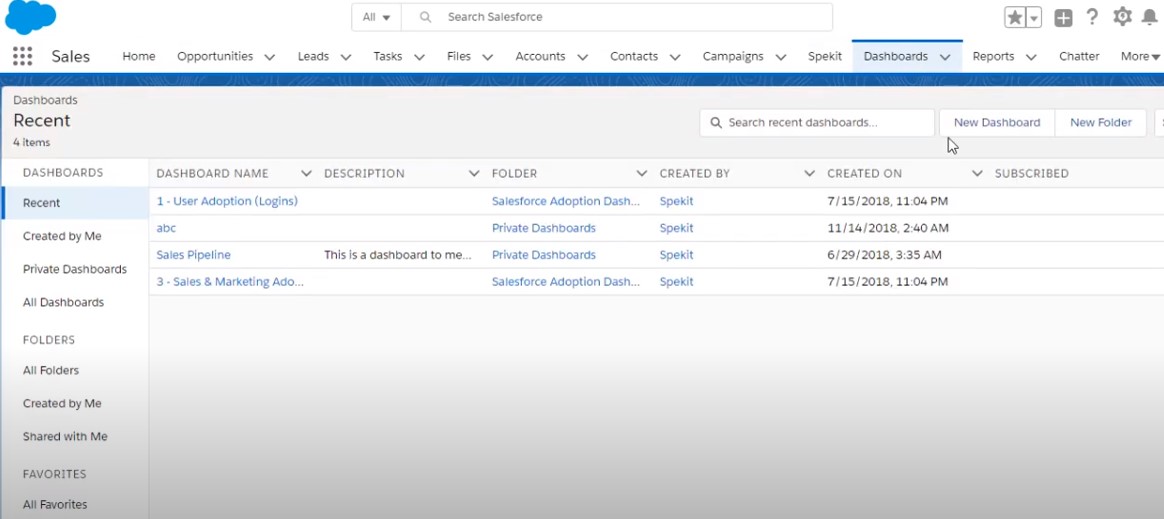
- Dashboard Editor: The dashboard editor is a drag and drop interface that can be used for creating dashboards We can easily add the dashboard components, arrange them as per layout, and delete if not required. We can start creating a new dashboard, by clicking on the option “New Dashboard”.
- Components: There are multiple components available to build the dashboard. It could be a chart, graph, or even a metric. These components reflect the data from a different report.
- End-User: The users can access the dashboard, but they can view only that data, for which they have privileges. A dashboard will exhibit the complete set of data, but the users can view only what they are supposed to as per their privileges.
- Filters: We can apply filters on the dashboard to analyze the based on certain fields or fields, with a more customized view. This is something we do in excel dashboards as well.
Components in Dashboard
There are multiple components available on Salesforce, which can be used for creating the dashboard on Salesforce:
- Chart: Charts are used to display the data graphically. There are multiple types of charts available on Salesforce, that can be used for preparing the dashboard.
- Gauge: Gauge is used for showing value on a defined scale.
- Metric: Metric component is used for displaying a specific value.
- Table: Table component is used for representing data in column format.
- Visualforce Page: Visualforce page can be used for creating personalized content.
Creating a Dashboard in Salesforce
One of the mandatory steps before creating the dashboard is to create a report. The report becomes the source for the Dashboard. It's unlike in excel, where you can add the columns straightaway, and create a dashboard. Lets quickly run through the steps for creating a report.
- Select the reports to tab on the Salesforce homepage.
- Click on “New Report”, and select an object for the report type. For example, sales.
- Implement the filters.
- Select the complete set of contact for the organization.
- Now click on “Create Date”, for creating the date.
- Select “All Time”, for extent.
- For this example, we are creating a “Summary Report”, so from “Tabular Format” select “Summary”.
- Now select the fields that will be displayed on the report.
- Run the report, and save the report.
Our report is ready now, and we can kickstart the process of creating the dashboard.
- Let's go back to the Dashboard tab on the homepage.
- Click on “New Dashboard”.
- Drag and drop the “Pie Chart” component.
- In the next step, select the data sources tab.
- Select the report which we have created in the last section, and include the report in the pie chart component.
- The chart will be generated, and we can customize & edit it as per the requirements.
- Enter the “Title” and the “Footer”.
- Click “Ok”.
- Click on “Save”, to save the dashboard. Name it as “My_Dashboard”.
- Click on “Run Dashboard”, to run the dashboard.
Limitations of Dashboard
The dashboard has certain limitations, which we should consider while preparing the dashboard.
- Dashboards can be created only from Matrix reports and Summary reports. If you have tabular reports or joint reports, it needs to be converted into either of the acceptable formats of reports, before using it for the dashboard.
- Even though the dashboard filter has 50 options, only ten are enabled by default. If you need more filter options then you have to raise a support case with the Salesforce support team.
- You can add only up to 20 components to the salesforce dashboard.
- A dashboard table can display only up to twenty photos.
- If there is a change in the backend report, the refresh on the front dashboard doesn’t happen instantly, as the duration between two refreshes in one minute.