
Monitoring Debug Logs in Salesforce
Debug logs are the best option to track back events that might have happened in the Org. Specifically, if we are doing root cause analysis for a particular problem, we can trace out the root cause from the debug logs. The debug logs will get generated when the user based trace logs are active, when the Apex tests are run, when a code is executed and when API calls are made. This should include the debugging parameters as well.
The debug log can record the database operations, system processes, and errors, that might occur when a transaction gets executed, or a unit test is run. Debug logs contain certain key information, which is listed below:
- HTTP Callouts
- Database changes
- Apex Errors
- Resources used by Apex
- Automated Workflow processes (Workflow Rules, Assignment Rules, Approval Processes, Validation Rules).
It has to be noted that debug logs will contain any information about actions, that have been triggered by the time-based workflows. The debug log will be generated every time a transaction is executed, provided this transaction type is included in the filter criteria. Transactions can be triggered by the following Salesforce components:
- APIs in Salesforce
- Salesforce UI
- Web Services
- Email Services
- ExecuteAnonymous calls
Their filter criteria are set for the following, which determine what is included in the debug log.
- User
- Developer Console
- API
Use cases of debug logs
Debug logs can be used by the developers for tracing any errors that might have occurred on the application. For example, the application is not stable or it is impacting the performance of the other components, or it might stop responding after a certain user input because exceptions are not defined. All these things can be traced from the debug logs. And, action can be taken by looking at the details of the debug logs. We can look at the callouts listed in the debug log, and take action. Apart from the developer, debug logs can be used by the administrator. For example, there is an application error which is preventing the user to complete his operation. The error can be traced to the system details that will be available in the debug log.
Limitations of the Debug Log
Debug logs are undoubtedly helpful for monitoring the platform, but it has certain limitations as well.
- The size of the debug log is limited to 20MB. If it exceeds 20MB, then the older lines are removed. The lines can be removed from any location rather than from a single dedicated location or in chronicle order.
- System debugs logs, that are more than older than 24 hours will not be retained. However, monitoring debug logs are retained for seven days.
- In case the debug logs generated in 15 mins is more than 1000 MB, then trace flags are disabled. Users who have last modified the trace flags will receive the email notification when the trace flags will be disabled.
Setting Up the debug logging
Debug logging can be activated for Apex classes & triggers and normal users. For this, trace flags need to be configured along with the debug levels, in the Developer Console. Each trace flag will contain the following:
- Debug Level
- Start time
- End time
- Log Type
The log type for the trace flag will specify the entity that is being traced.
We can configure the Trace Flags from the Developer console as well as Setup.
- Log in to the developer console.
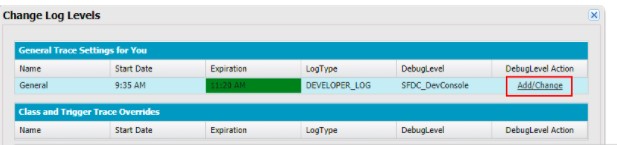
- Click on Debug – Change log levels.
- Click on Add.
- Edit an existing trace flag by editing the start or the end time.
- If you want o change the debug level of the trace flag, then click on “Add/Change”, in the debug level action column. We can edit the existing debug levels. We can even create or delete a debug level. We can also assign a debug level to the trace flag.
We can also do the above activities from setup.
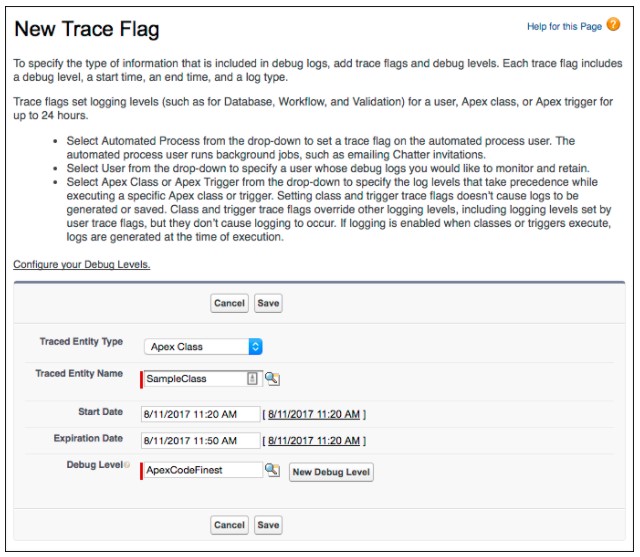
- Go to setup, and from the quick find box, find “Debug Logs”.
- Click on “New”.
- Select the entity for which the logs will be enabled. Set the period and debug level.
Now once we have set up the trace flags, we can view them, edit them and even delete them. We can do this from Setup.
For example, we assume that we want to edit the trace flags for Apex Classes.
Setup –> Debug Logs –> Apex Classes –> Trace Flags
Once you see the list of the trace flags, you can edit them or delete them if they are no longer required.
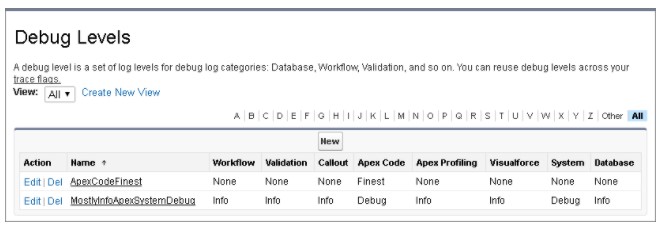
Configuring the debug Levels in Setup:
We can manage the debug levels from “Setup”. To do this we can go to Setup, and then to Debug Levels through the quick find box. Click on the action column, to edit or delete the debug levels.
Debug Log Details
Analyzing the debug log is an art, and might need prior experience as a developer or administrator. However, if you are aware of the components of the debug logs, at least you will be aware, where to look for what. The components of the debug log are mentioned below:
- Header: The header will state the API version that has been used for the transaction. It will also state the log category level that has been used to
- Execution Unit: This will state whatever happened within a transaction. A transaction in this case could be a mere event.
- Code Unit: This is the discrete unit of work within a particular transaction.
- Log Lines: This provides the information on which code lines were executed during the transaction, along with the event details and time stamp.