
Tabular & Summary Reports in Salesforce
Salesforce provides different forms of reporting formats, for presenting the data. In this tutorial, we will discuss the tabular reporting and summary reporting.
Tabular Reports
If you have used excel for data presentation, you might be already aware that tabular reports are the easiest as well as a convenient way to present the data. Just a few clicks and we are done. That is why we always considered spreadsheet as one of the easiest and fastest platforms for presenting data. But, you will be surprised that Salesforce also allows us to create data just like spreadsheet Tabular reports can be created for simple and straightforward data presentations. It is not the best option for complex data representations where multiple groups of data are considered as a source. Also, it has certain limitations, when it comes to integrating into the dashboard. But they are the best bet for simple task lists, such as names of employees in a depart or mailing list.
Creating a tabular report
Let us quickly check how we can create a simple tabular report. Let us assume that we are preparing data, where we want to show the names of all the account executives, who have open sales opportunities. The sales team wants this data so that they can follow up on the open opportunities and convert them into potential sales.
- Login to your Salesforce account.
- Now click on the Reports tab, that is located beside the Dashboard tab.
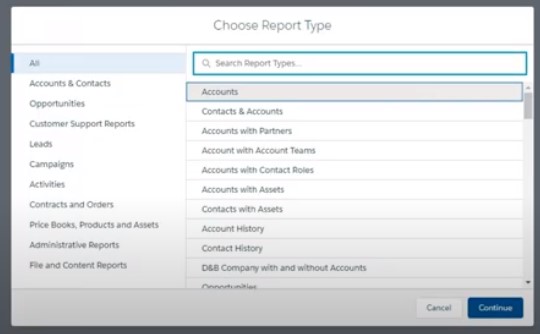
- Click on the “New Report” option.
- Select the report type as “Opportunities”.
- Click on “Create”.
- Now we will customize the report to get our desired output. We will do this by setting the filters.
- Select all the opportunities for “Show”.
- Select the status as “Open” (As we want to present only the opportunities).
- Select “Create Date” for the date field.
- For the Range option, select “Current FY”.
- Once we apply the filter, the report format will show up with all the required columns.
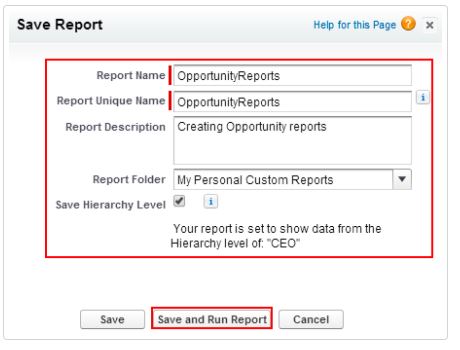
- Click on “Save”, and provide the report name.
- Enter a description for the report, and then chose the “My Personal Custom Reports” folder for saving the report.
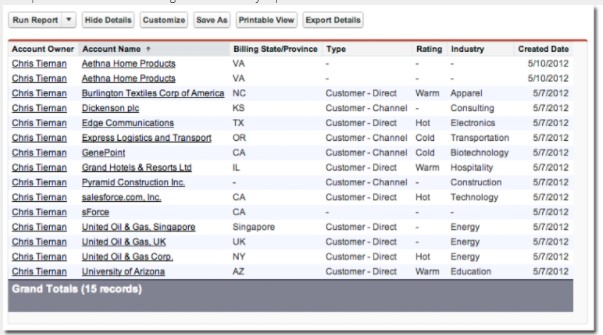
- Click on “Run Report”.
We will have the report displayed on the screen.
Summary Report
Summary reports are similar to the tabular reports in terms of the format, with little variation. A summary report allows different users to group the rows of data, as per their preferences. For example, we can create subtotals, and create a chart based on that. The summary report provides more options in terms of customization. It is a much better option in comparison to the tabular report when it comes to organizing the data and integrating it with a dashboard.
Creating a Summary report
Let us assume that the Service Delivery Manager wants an analysis of the closed cases from the past year, grouped by the priority. The objective here is to perform a summary of the closed cases, and derive a conclusion on the performance of the support team.
- Go to the Report tab, on the Salesforce homepage.
- Click on New Report.
- Chose report type as “Case”.
- Click on “Create”.
- Now apply the filters, to customize the report.
- Select “All Cases” for the Show option.
- Select “Date Opened “ for Date Field.
- Select “Current FY” for Range.
- In the next step, apply the additional filter, that is cases, where the status is equivalent to “Closed”.
- Add all the required columns to the report.
- In the next step, select “Tabular”, and then “Summary”.
- We have created the report format, but we have not set the priority yet. Here, we have to prioritize the report, on the closed cases. Drag the priority field from the Fields pane, and drop it into the section titled as “Drop a filed here to create a grouping”
- Click “Save”, provide a name to the report.
- Enter a description for the report, and then chose the “My Personal Custom Reports” folder for saving the report.
- Click on “Run Report”.
The summary report is created now. Once you run the report, the report will be displayed on the screen.